Project information
- Project name: Mapillary Dataset Visualizer for Instance Segmentation
- Project URL: GitHub Repository
Project overview
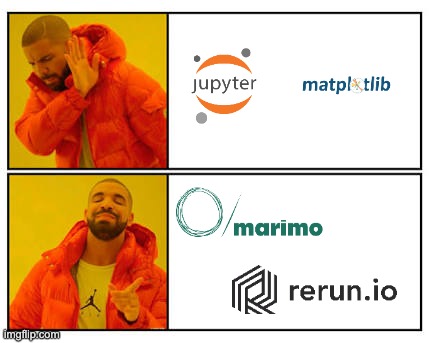
This project delivers advanced, interactive visualization for the Mapillary Vistas Dataset by combining marimo and Rerun. It merges the clarity of static Matplotlib outputs with powerful, real-time 2D/3D exploratory views in Rerun, enabling seamless inspection of instance-level annotations.
marimo acts as a reactive notebook environment and lightweight app framework, so code and outputs stay in sync while you experiment, debug, and explore complex urban scenes from Mapillary Vistas.
Features
- Dynamic visualization of Mapillary Vistas images and instance annotations.
- Dual-output workflow: static Matplotlib figures plus interactive Rerun views.
- Reproducible, Python-first workflow with marimo notebooks
stored as plain
.pyfiles. - Fast, isolated virtual environments and dependency
management via
uv.
Getting started
- Install and extract the Mapillary Vistas Dataset locally, then point the project configuration to your dataset path.
- Create a virtual environment with
uv venv
                      .venv
and install dependencies viauv sync. - Launch the app with
uv run marimo edit main_marimo.pyto open the interactive notebook interface.
Expected outputs
- Static Matplotlib overlays with colored instance masks for quick qualitative inspection.
- Interactive Rerun windows with camera controls, timelines, and rich 2D/3D primitives for exploring scenes.
Future work
- Add semantic and panoptic segmentation visualizations.
- Extend configuration to support multiple datasets and custom class mappings.
- Provide additional example notebooks for analysis and error diagnosis workflows.

